OilChem China
A peak of capacity additions in 2019
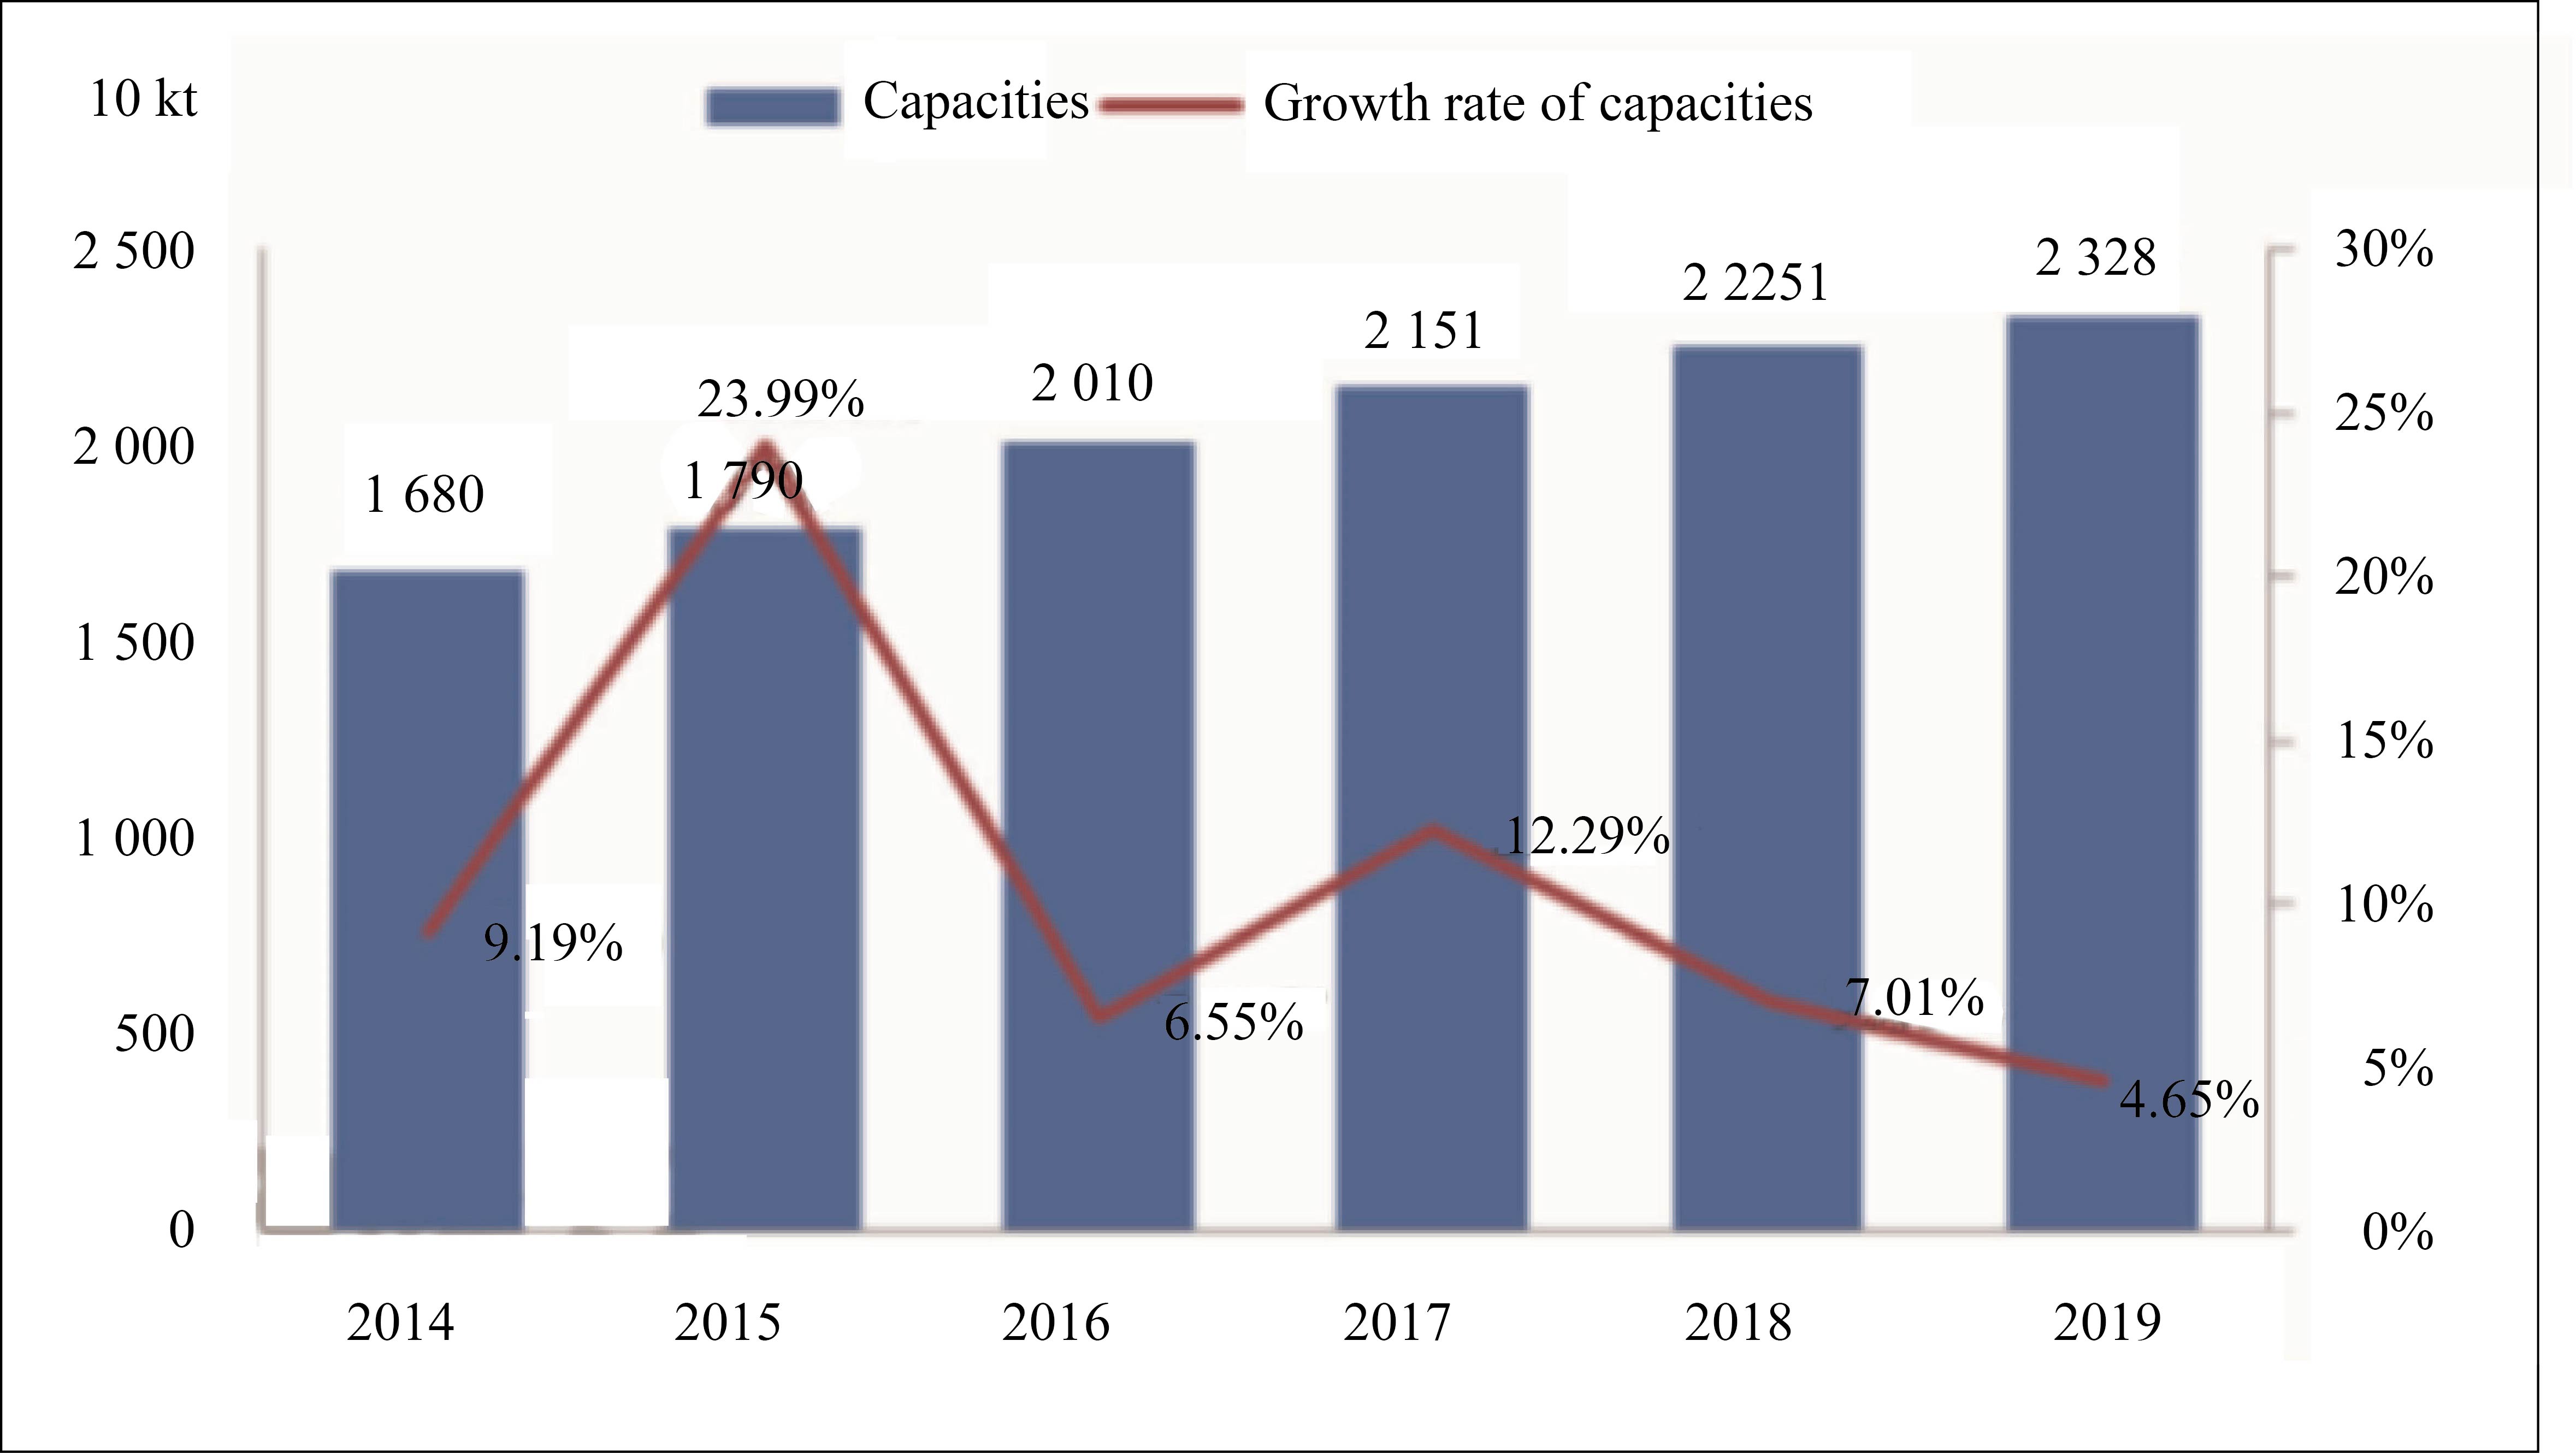
Year 2019 is expected to see capacities reach a peak of 2.95 million t/a following the start-up of PP plants in China. By June 2019, the total capacities hit 23.28 million t/a, largely located in northwest, east, north, south and northeast China.

Figure 1 Chinese PP capacities from 2014 to June 2019
Capacities in regions in the first half of 2019 were largely flat with the same period of last year. To be specific, Inner Mongolia Jiutai Group’s new 320 kt/a unit added the capacities in northwest China to 6.79 million t/a, accounting for 29.9% of the domestic total. There were no new plants put into production in east China on a year-to-date basis and the total capacities amounted to 4.3 million t/a, only down by 1% to 18.4% compared with the same period of last year. Capacities took up 17.4% and 15.8% respectively in south and north China. Dalian Hengli’s new 450 kt/a plant contributed new capacities to northeast China. The regional capacities reached 2.47 million t/a or 11% of the total, up by 2% year on year.
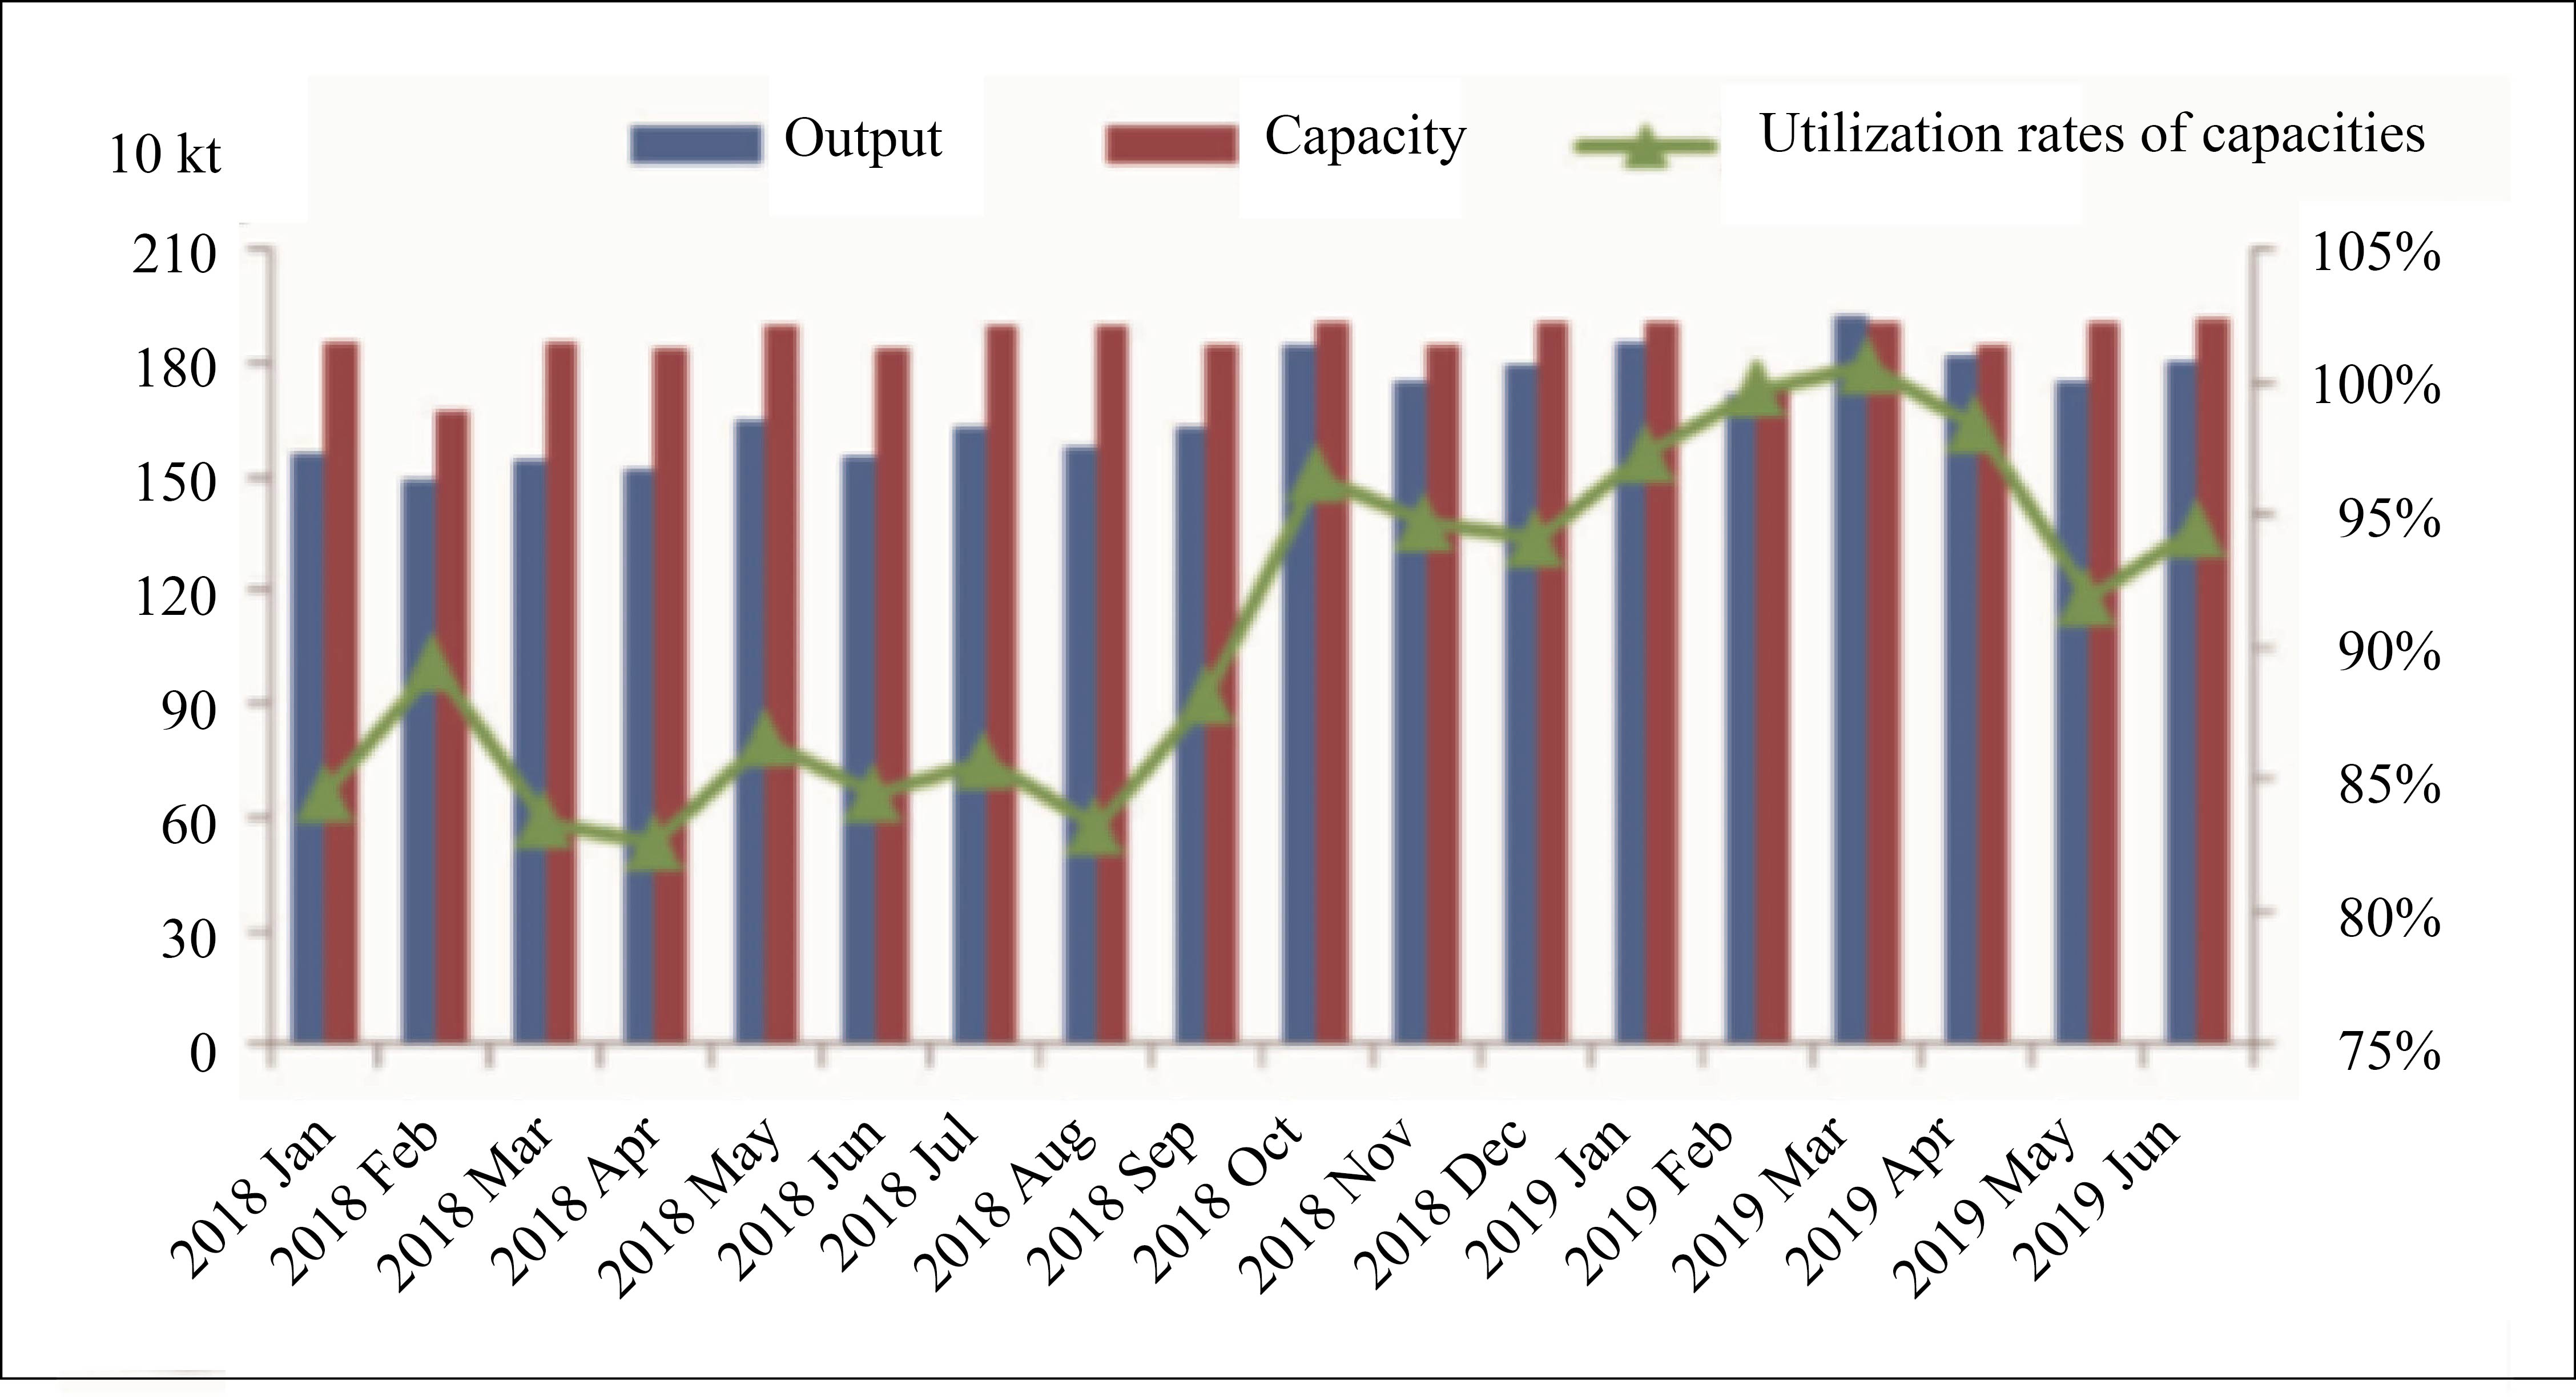
The average operating rates of domestic PP plants was at 97% in the first half of 2019 (Figure 2) versus 85% in the first half of 2018. The domestic PP output reached 10.89 million tons accumulatively in the first half of the year, up by 1.56 million tons or 16.71% year on year.

Figure 2 Monthly Chinese PP output and utilization rates of capacities during 2018-2019
China’s PP import volumes were around 2.05 million tons from January to May of 2019, an increase of 7.15% compared to the same period of last year. Export volumes in the first half of 2019 showed a year-on-year decline.
Raffia yarn consumption ranked top among PP grades
Of PP consumption fields in China in the first half of 2019, raffia yarn was ranked the top with 36.51% and copolymer injection came as the second with 23.48%, followed by homopolymer injection and homopolymer fiber with 12.90% and 9.34% respectively. BOPP consumption accounted for 6.52% of the total, pipeline 4.52%, CPP 2.75% and other specialty grade 1.48%.
The proportion of raffia yarn capacity increased by 0.08% on a year-on-year basis; that of homopolymer injection capacity increased by 1.53% due to robust demand for thin-wall injection; that of copolymer capacity rose by 3.05% following the surged prices in October 2018, but the output growth capped the prices to a relatively low level this year. The proportion of fiber-grade capacity fell by 2.14% because of low operating rates of downstream non-woven fiber plants. The proportion of BOPP was also on a decrease, as demand for BOPP film was being replaced by yarn; that of transparent-grade capacity dropped by 0.97% year on year, as rapid supply growth exerted inventory pressure on suppliers.
Output of plastic products tracked the downward trend from the beginning of this year, as supply of new materials continued to increase while supply of renewable materials shrank sharply due to environmental protection. The accumulated output during January-May was at 26.08 million tons, a decline of 4.86 million tons or 15.72% year on year.
Prices largely in downside in 1H
PP prices fell across the board in the first half of 2019, especially in the second quarter when supply was further increased by the start-up of Jiutai Energy’s and Dalian Hengli’s new plants. Domestic raffia prices were at RMB8 780/t averagely, down by 7.62% year on year. The operating rates of domestic plastic woven plants were around 60% in the first half of 2019, flat compared to the same period of 2018.
Domestic BOPP operating rates maintained at a low level of 54.6% during the period, but the rates were expected to increase in the second half of this year, as demand was likely to strengthen in September-October and December-January of the next year.
Supply-demand influenced by multi-factors
A total of 4.9 million t/a capacity was predicted to come on stream in the second half of 2019. Table 1 displays the PP capacity expansion in China during 2019-2020.
Table 1 Chinese PP capacity expansion, 2019-2020
Producer | Capacity (kt/a) | Scheduled start-up time | Feedstock |
Hengli Petrochemical | 450 | May 2019 | Oil |
Jiutai Energy Inner Mongolia Co., Ltd. | 320 | May 2019 | Coal |
Dongguan Grand Resource Co., Ltd. | 600 | June 2019 | Propane |
Ningxia Baofeng Energy Phase II | 300 | Trial run in July 2019 | Coal |
Zhongan Union Coal Industry Chemical Co. Ltd. | 350 | Trial run in July 2019 | Coal |
Qinghai DMCIC | 400 | September 2019 | Coal |
Zhejiang Petrochemical | 900 | Q4 2019 | Oil |
Gansu Huating | 200 | October 2019 | Coal |
Liaoning Baolai Petrochemical | 600 | Q4 2019 | Oil |
Hengli Petrochemical Phase II | 300 | Q4 2019 | Oil |
Daqing Lianyi Petrochemical Co., Ltd. | 500 | Q4 2019 | Oil |
ZhongKe (Zhanjiang) Refinery & Petrochemical Co., Ltd. | 750 | Q4 2019 | Oil |
Ningbo Fortune Petrochemical Co.,Ltd. | 800 | Q1 2020 | Propane |
Shenhua Ningxia Coal Industry Group Co., Ltd. Phase III | 300 | 2020 | Coal |
Yantai Wanhua | 300 | 2020 | Propane |
From the perspective of PP supply there will be limited capacity expansions overseas, resulting in a reduction in PP import volumes and resultant import dependency.
Demand has been increasing in September and a further rise is expected in October, as the period of September-October is a traditional peak season for consumption. This will be very supportive to the domestic prices in the third quarter. However, the prices in the fourth quarter are expected to fall as a result of an increase in supply and a decline in demand.