
By Tan Jie, Sinopec Maoming Research Institute
Polyethylene products are comprised of low-density polyethylene (LDPE), high-density polyethylene (HDPE), and linear low-density polyethylene.
According to the statistics of China Customs, from 2017 to 2020, the imports of China’s polyethylene increased from 11 793 500 tons to 18 353 700 tons. In recent 2 years, China’s polyethylene productivity and output have increased as many newly built and expanded polyethylene devices were put into production. And these polyethylene devices were introduced into companies and projects including Zhejiang Petroleum & Chemical Co., Ltd., Hengli Petrochemical Co., Ltd., Zhongke Refinery & Petrochemical Co., Ltd., Sinochem Quanzhou Petrochemical Co., Ltd., CNPC Lanzhou Petrochemical Co., Ltd., Shaanxi Yulin Energy Chemical Co., Ltd., and the projects of using ethane to produce ethylene in Sinopec Dushanzi Petrochemical Co., Ltd., Luqing Petrochemical Co., Ltd., and Wanhua Chemical Group Co., Ltd.. Besides, in 2021, the factors, including foreign supply decrease, soaring prices and domestic steady consumption, led to the import decrease of China’s polyethylene for the first time in 2021. The imports were 14 585 700 tons, 21.30% lower than a year before. As for export, China’s polyethylene exports were 246 800 tons in 2017, 252 300 tons in 2020, while they dramatically increased to 511 100 tons in 2021, with a year-on-year growth of 102.58%.
Import and export analysis of LDPE
1. Import analysis
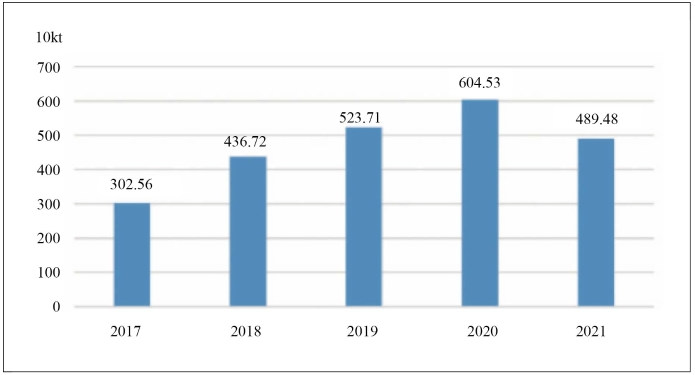
From 2017 to 2021, China’s LDPE imports increased at first, and then decreased year by year, while the import price trend was on the contrary. In 2017, the import price was US$1 272.55/ton, while that of 2021 was US$1 412.21/ton. The import changes from 2017 to 2021 are shown in Picture 1.

Picture 1 The import changes from 2017 to 2021
In 2021, China’s LDPE was mainly imported from 7 countries, including the UAE, South Korea, Qatar, United States, Saudi Arabia, Iran and Singapore, and combined imports from the 7 nations were up to 2 324 800 tons, totally holding 75.987%, 2.70% lower than a year before. And Iran had the biggest volume of with 755 100 tons, 7.17% higher than the last year, followed by the UAE whose imports were 352 000 tons, 9.11% higher than one year before.
In 2021, the import mode of China’s LDPE was mainly trade, with imports of 2 651 400 tons, totally accounting for 86.65%, 11.68% lower than a year before.
2. Export analysis
From 2017 to 2022, China’s LDPE export increased gradually, of which the exports were 54 000 tons in 2017, rising to 153 500 tons in 2021, 84.50% higher than a year ago. And during the same period, China’s export price decreased initially, and then increased yearly. In 2017, the export price was US$1 613.02/ton, falling to the lowest point of US$1 393.95/ton in 2019, while that of 2021 reached the highest point of US$2 196.25/ton, 10.74% higher than a year before.
In 2021, China’s LDPE was mainly exported to 6 countries including Malaysia, Vietnam, Cambodia, South Korea, Saudi Arabia, and Thailand, with total exports of 72 900 tons, 125.70% higher than a year before.
In 2021, the export mode of China’s LDPE was mainly trade. The exports were 89 700 tons, accounting for 58.44% totally, 88.45% higher than a year before.
Import and export analysis of LLDPE
1. Import analysis
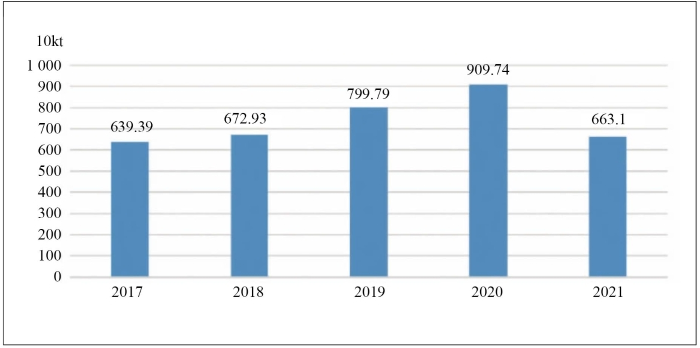
From 2017 to 2021, China’s LLDPE imports increased yearly at first but decreased in a later period. The import changes of China’s LLDPE are shown in Picture 2.
Picture 2 The import changes of China’s LLDPE from 2017 to 2021
From 2017 to 2021, the import price of China’s LLDPE dropped yearly and then saw an increase. As for 2017, the import price was US$1 206.63/ton, reaching the top, while that of 2021 was US$1 154.17/ton, 32.65% higher than one year before.
In 2021, China’s LLDPE was mainly imported from 7 countries including Singapore, Saudi Arabia, Thailand, Iran, United States, UAE, and South Korea. Imports from the 7 sources amounted to 3 760 000 tons, 9.89% lower than a year before. And China’s LLDPE import modes focused on trade and processing with imported materials, and the total imports reached 4 586 500 tons, accounting for 93.70% totally, 19.19% lower than a year before.
2. Export analysis
From 2017 to 2021, China’s LLDPE exports decreased at first and then increased year by year. In 2017 the exports were 39 149.57 tons, followed by the minimum value of 32 279.52 tons in 2018, 17.55% lower than a year before. In 2021, the exports were 79 131.13 tons, with a year-on-year growth of 113.46%. From 2017 to 2021, the export price of LLDPE declined year by year initially, and improved afterwards. And the export price reached the highest point of US$1 511.08/ton in 2017, while that of 2021 was US$1 342.46/ton, increasing 22.24% when compared with the lowest value of US$1 098.25/ton.
In 2021, China’s LLDPE was dominantly exported to 7 countries and regions including China Hong Kong, Vietnam, Brazil, Cambodia, Bangladesh, India, and Japan. And the exports amounted to 52 315.18 tons, accounting for 66.11% totally, 115.89% higher than a year before. During the same period, the export modes of China’s LLDPE mainly focused on general trade and goods trade by Customs in particular supervision areas, with total exports of 67 867.05 tons, holding 85.77% totally, 136.29% higher than a year before.
HDPE import and export analysis
1. Import analysis
From 2017 to 2021, China’s HDPE imports increased yearly and then gradually decreased. The imports changes of China’s HDPE in this period are shown in Picture 3.
Picture 3 The imports of China’s HDPE from 2017 to 2021
From 2017 to 2021, the import price of China’s HDPE saw fluctuations but increased finally. And in 2017 the import price was US$1 179.79/ton, while that of 2018 reached the maximum value of US$1 311.57/ton, 11.17% higher than a year before. In 2021, the import price was US$1 112.23/ton, 27.32% higher compared with the lowest value of US$873.59 in 2020.
In 2021, HDPE imported from Saudi Arabia, Iran, the United Arab Emirates, Russia and South Korea amounted to 4 920 300 tons, accounting for 74.20% totally, with a 19.88% decrease year-on-year.
In 2021, import modes of China’s HDPE focused on general trade and processing with imported material, with total imports of 6 002 700 tons, accounting for 90.52% totally, 29.05% lower than a year before.
2. Export analysis
From 2017 to 2021, China’s HDPE export experienced fluctuations, but finally returned to the increase. And in 2017, the exports were 153 700 tons, which fell to an all-time low of 130 000 tons in 2018, 15.42% lower than a year before, while that of 2021 was 278 500 tons, 110.98% higher than a year before. In 2017, the export unit price was US$1 395.77/ton, while that of 2018 reached the peak value of US$1 572.03/ton, 12.63% higher than a year before. And in 2021, the export unit price was US$1 336.72/ton, 13.36% higher when compared with the minimum of US$1 179.16/ton in 2020.
In 2021, China’s HDPE was exported to 8 countries and regions including China Hong Kong, Brazil, Colombia, Germany, Vietnam, Mexico, Peru, and Guatemala, with total imports reaching 144 600 tons, accounting for 51.92% totally, 99.45% higher than a year ago.
In 2021, the export modes of China’s HDPE centered on general trade and goods trade by Customs in particular supervision areas. The exports amounted to 222 600 tons, accounting for 79.93% totally, 177.90% higher than a year before.
Peroration
Based on above analysis, China’s polyethylene imports were on the increase, while that of 2021 had a decrease, 21.30% lower than a year before. And LDPE imports fell by 9.76%, 19.03% for LLDPE, and 27.11% for HDPE. Import sources mainly included Saudi Arabia, Iran, UAE, South Korea, Singapore and the United States and related trade modes focused on general trade and processing with imported material.
From 2017 to 2020, China’s polyethylene exports didn’t have substantial changes, while in 2021 had a sharp increase of 102.58% from a year earlier. And LDPE exports increased 84.50% than a year earlier, and 113.46% for LLDPE, 110.98% for HDPE. Export destinations mainly included China Hong Kong, Vietnam, Cambodia, Malaysia, South Korea, Brazil and Colombia and related trade modes were mostly based on general trade and logistic trade under special supervision of Customs.
In the next few years, many companies plan to build new devices or introduce more polyethylene devices, including Sinopec Zhenhai Refining & Chemical Co., Ltd., Zhejiang Petroleum & Chemical Co., Ltd., Wanhua Chemical Group Co., Ltd., Sinopec Tianjin, Shandong Jinhai Chemical Co., Ltd., Shandong Rongxin Group Co., Ltd., Gulei Refinery & Chemical integration project, Guangzhou Petrochemical Co., Ltd., Tianjin Bohai Chemical Industry Group Co., Ltd., Qinghai Damei Coal Industry Group Co., Ltd., Sinopec Guizhou Great Wall Energy & Chemical Co., Ltd., Sinopec Zhongyuan Petrochemical Co., Ltd., Sinopec Hainan Refining & Chemical Co., Ltd., Longmay Mining Group Co., Ltd., Zhejiang Weixing Petrochemical Co., Ltd., Shanxi Coking Co., Ltd., and China Coal Shaanxi Group Coking Co., Ltd. At that time, China’s polyethylene productivity will keep increasing, and the development efforts of polyethylene will be intensified as production technology advances. In the next 2 years, China’s polyethylene imports are expected to decrease, but the overall status will not see big changes. Besides, with decreasing production cost and improving product quality, China’s polyethylene exports will gradually increase, but the overall status of export will not change dramatically. Therefore, domestic competition will be more severe.

