By Zhang Qisheng, Transportation and Sales Center of Tianjin Petrochemical
Largely balanced in domestic market, yet unbalanced in some regions
Domestic output is increasing sharply in line with higher operating rates of propylene oxide (PO) plants year by year, while downstream demand has entered a steady growth phase after a dramatic rise. The market is turning more and more balanced, but some regions remain unbalanced.
From 2014 to 2018, the compound growth rate of domestic PO capacity was at 3.68%, and that of output at 9.80%; while the compound growth rate of imports was at -12.16%, showing the import dependency was falling; the compound growth rate of total domestic supply reached 6.52%, and that of apparent consumption 6.24%. The supply and demand balance in China's PO market during 2014-2018 was shown in Table 1.
Table 1 China PO supply and demand, 2014-2018 (kt)
Year | 2014 | 2015 | 2016 | 2017 | 2018 |
Capacity (kt/a) | 2 767 | 3 007 | 3 111 | 3 197 | 3 317 |
Output | 1 897 | 2 100 | 2 425 | 2 502.3 | 2 757.6 |
Operating rates (%) | 68.56 | 69.84 | 77.95 | 78.27 | 86.26 |
Import volumes | 456 | 261 | 299.6 | 232.6 | 271.5 |
Export volumes | 0.2 | 0.4 | 29.9 | 3.6 | 31.4 |
Apparent consumption | 2 352.8 | 2 360.6 | 2 694.7 | 2 731.3 | 2 997.7 |
Import dependency (%) | 19.37 | 11.04 | 10.01 | 8.38 | 8.01 |
China's PO plants were mostly concentrated in Shandong, while the major consumption area was located in east China. The output in the northern part of China accounted for 64% of the national total, while the demand only occupied 36%, making the region in an oversupplies status, and turning east China the key distribution center of PO across the nation, as shown in Table 2.
Table 2 Domestic PO supply and demand by region (kt)
Region | Capacity (kt/a) | Output | Demand | |
North | Northeast China | 420 | 185.3 | 60 |
Shandong | 1 582 | 1 483.5 | 809.3 | |
North China | 100 | 101.1 | 209.8 | |
South | East China | 725 | 601.1 | 1 518.9 |
Central China | 340 | 28.4 | 40 | |
South China | 150 | 358.1 | 359.7 | |
Total | 3 317 | 2 757.6 | 2 997.7 | |
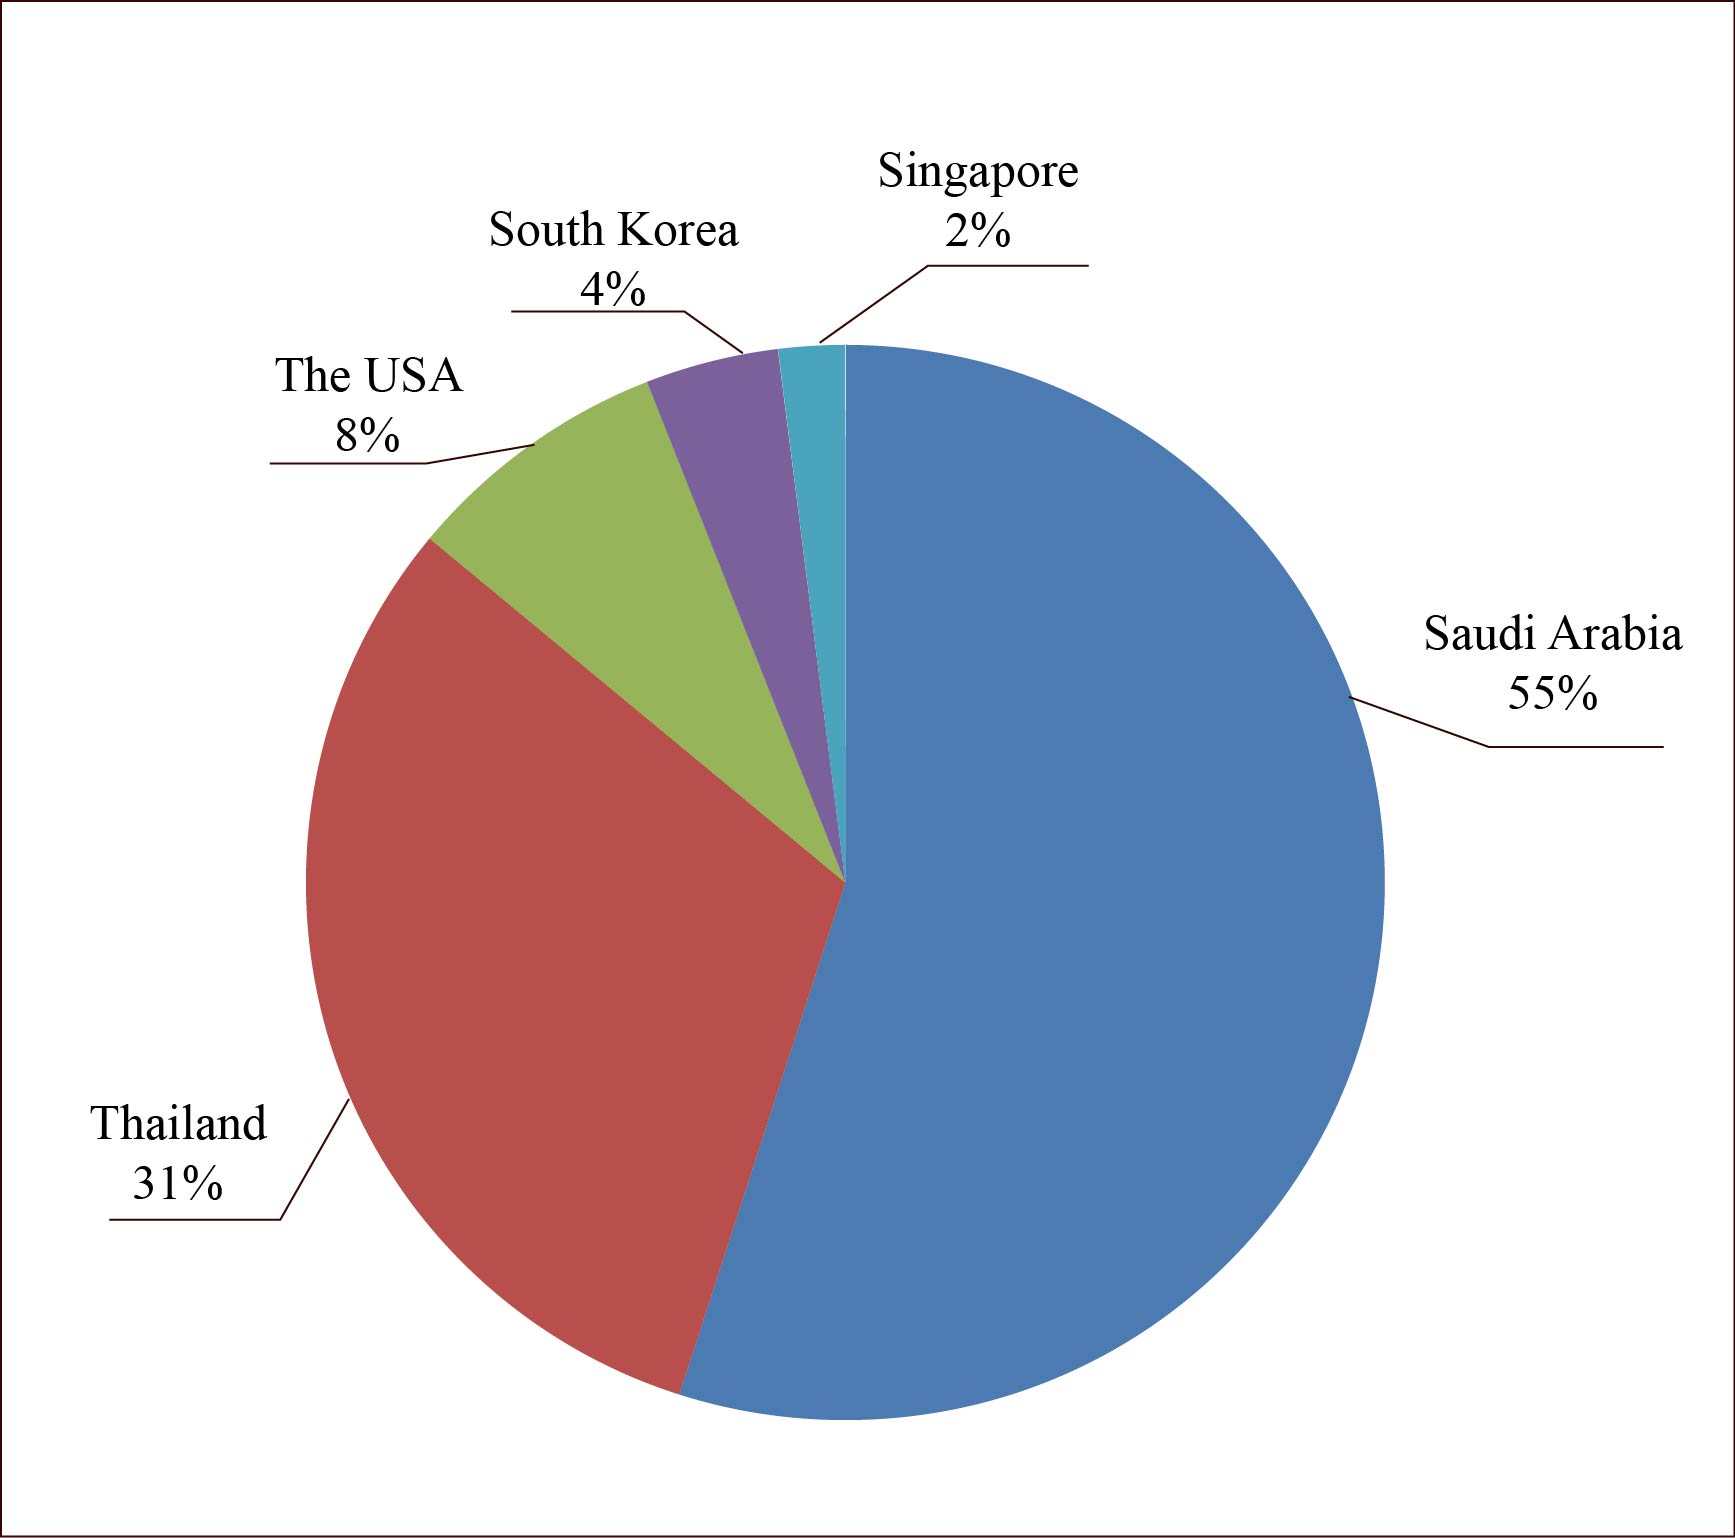
Although the successive release of new domestic capacities has gradually lessened the dependence on imported goods, the import volume of PO showed a slight increase in 2018. Table 3 showed the statistics of domestic PO imports from 2014 to 2018. Saudi Arabia, Thailand and the United States were major import origins in China in 2018 (see Figure 1). In the second half of 2018, the import volume from South Korea increased significantly to 11 000 tons. The import volume is expected to rise continuously in the next three to five years, but the sources will be diversified, which will lead to more furious competition in the import market.
Table 3 China PO imports, 2014-2018
Year | Import volumes (kt) | Import dependency (%) |
2014 | 456 | 19.37 |
2015 | 261 | 11.04 |
2016 | 299.6 | 10.01 |
2017 | 232.6 | 8.38 |
2018 | 271.5 | 8.01 |

Figure 1 Domestic PO imports by origin, 2018
Stable-to-higher demand, bullish outlook
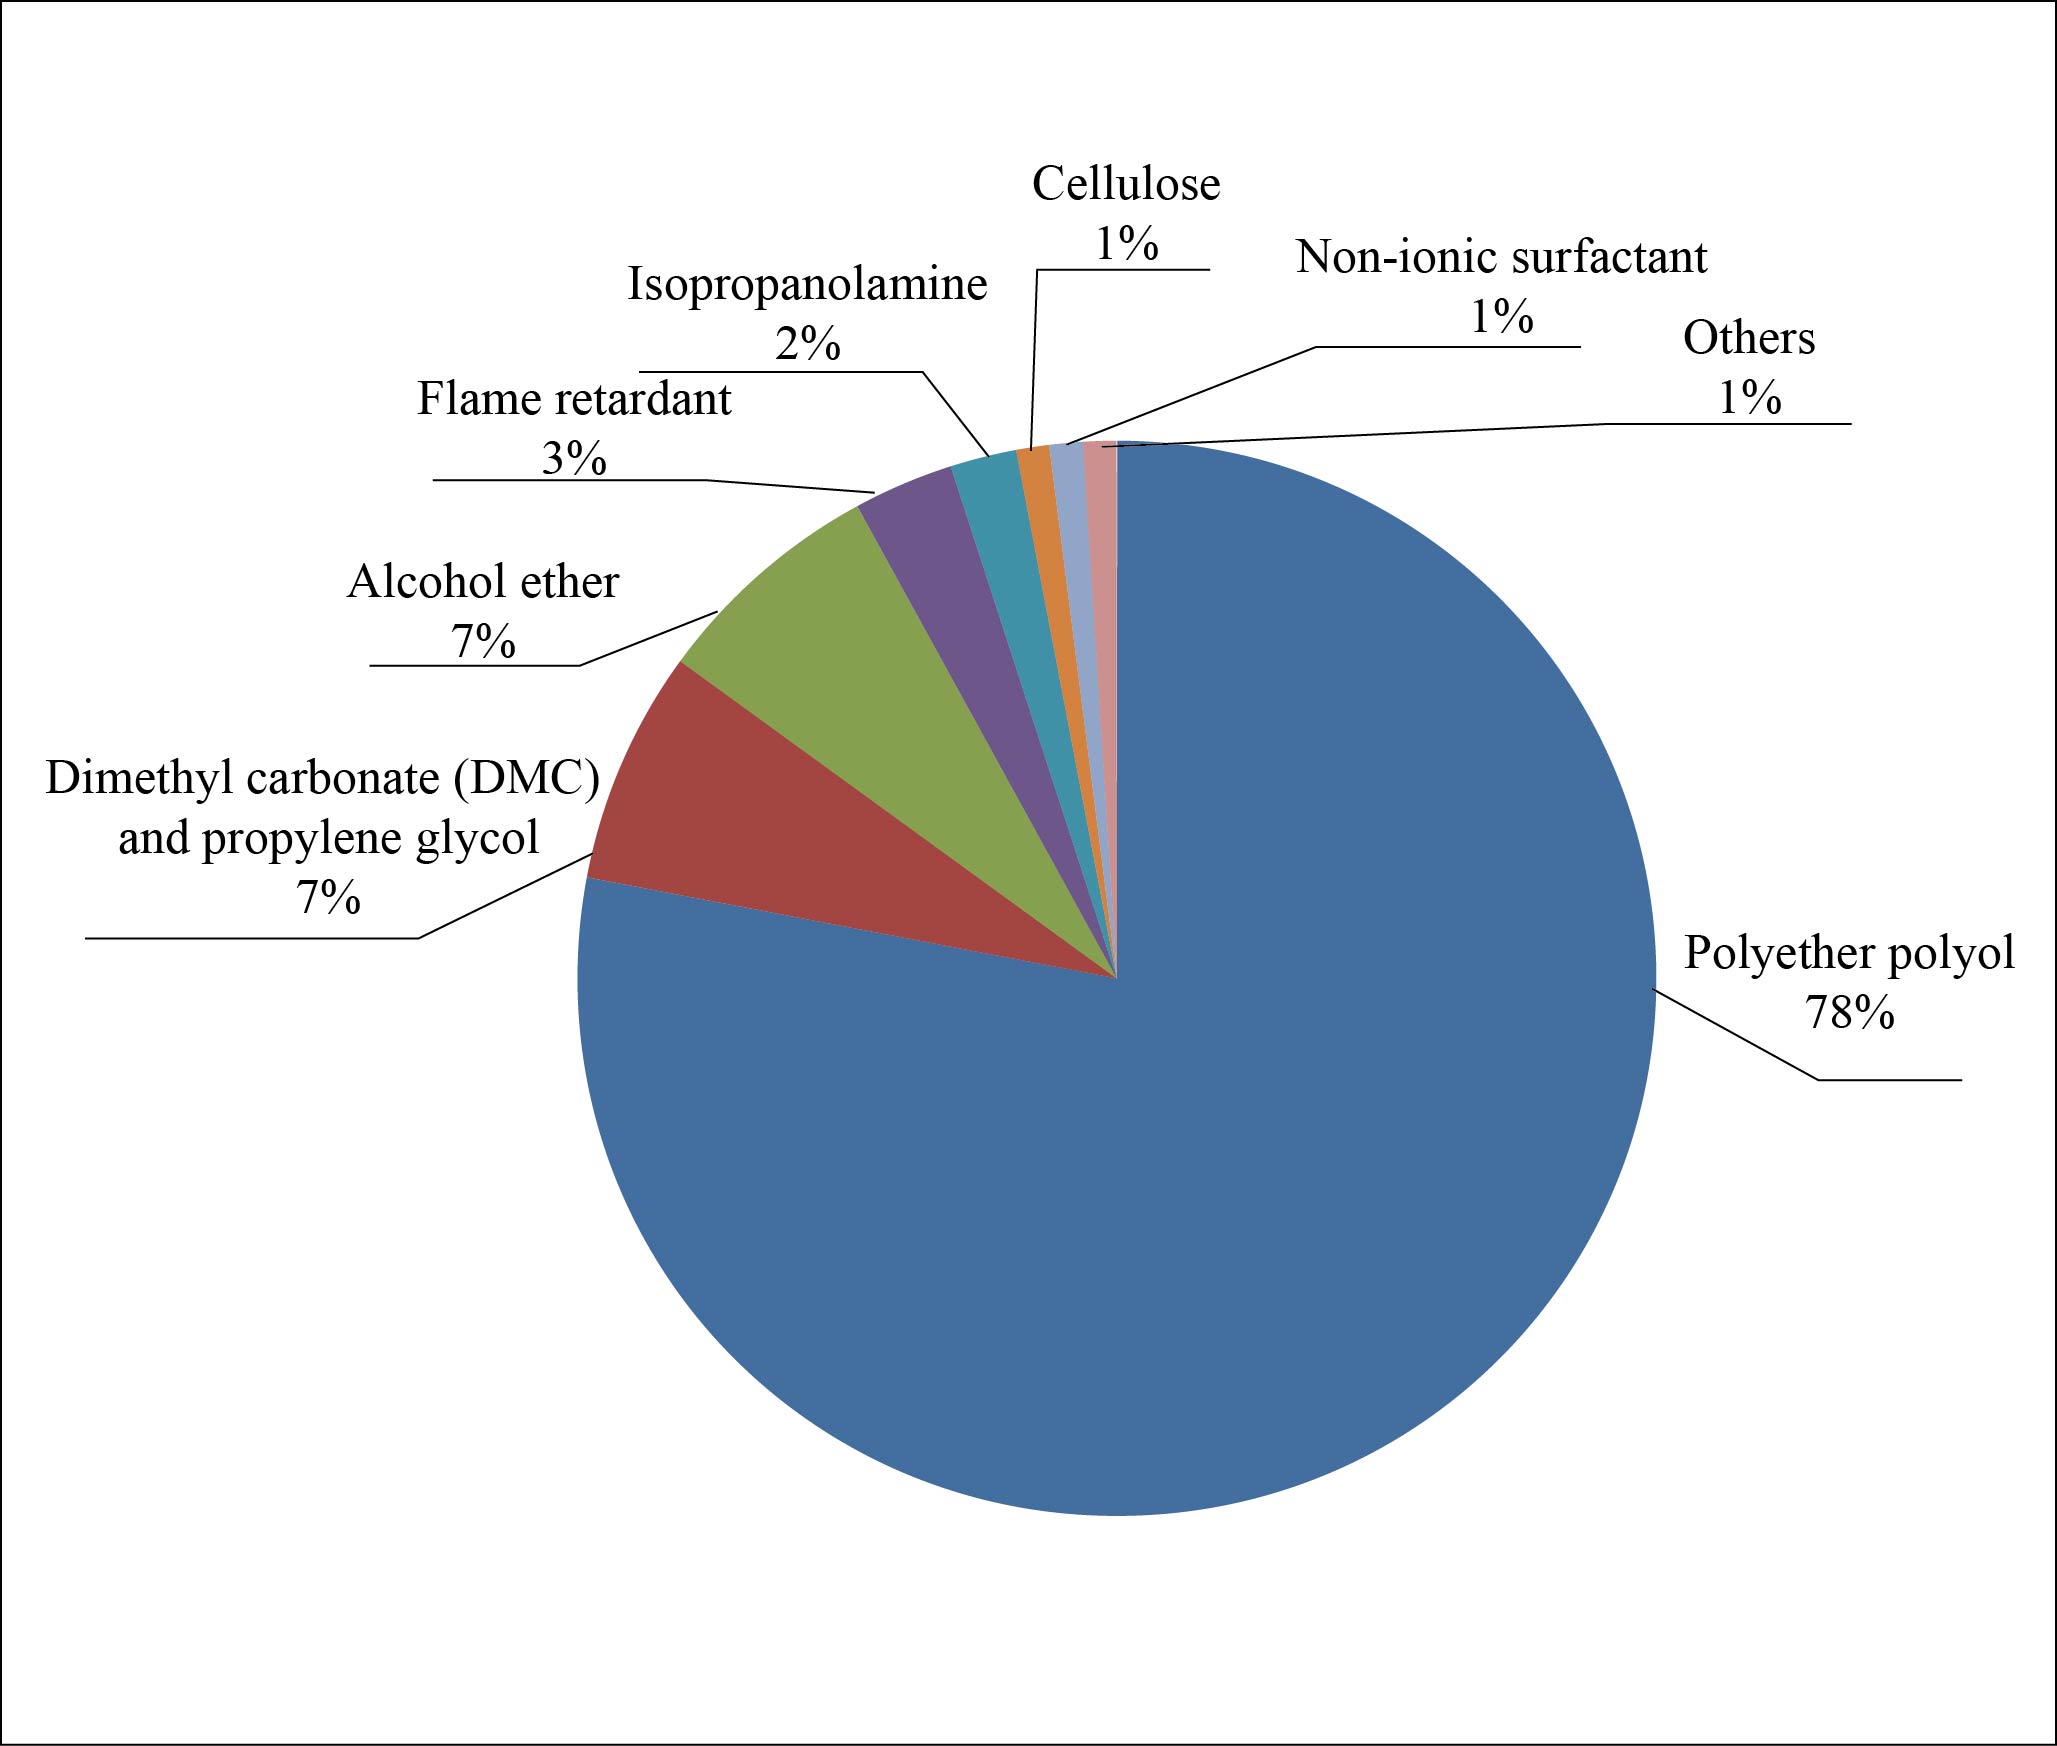
Polyether polyol is the major consumer of PO, which contributed 78% to the domestic PO consumption in 2018, as shown in Figure 2.

Figure 2 China PO consumption by application, 2018
In 2018, polyether polyol capacity was at 5.56 million t/a and output at 2.9 million tons, taking a year-on-year increase of 6.42%. Propylene glycol capacity was at 473 000 t/a and output at 310 000 tons. Among the alcohol ether grades, the capacity of PM was at 555 000 t/a and the output at 355 000 tons; the capacity of PMA was 490 000 t/a and the output was 320 000 tons. The demand from the flame retardant sector has been growing slowly in recent years, and the consumption of PO only took up 3% of the total in 2018.
It is estimated that the domestic polyether polyol capacity will increase by 900 000 t/a during 2019-2021, and hit 6.5 million t/a by 2021. The output will maintain a good upward momentum in the next three to five years, as fueled by end-use sectors including sponge, automotive, waterproof coating, and cold chain insulation industries.
The PO capacity is expected to increase by 3.01 million t/a in China from 2019 to 2021, as shown in Table 4. Specifically, the new capacity in east China will reach 1.15 million t/a, accounting for 37% of the total, mainly because the region is a major consumption region, with a big appetite for more supplies. As the government is posing higher requirements to the environmental protection, most of the new capacities will be based on the HPPO process and the PO/SM process.
Table 4 Domestic PO capacity ramp-up, 2019-2021
Region | Producer | Capacity ramp-up (kt/a) | Production process | Start-up time |
North China | Tianjin Dagu | 200 | PO/SM | 2020 |
Sinopec Tianjin Petrochemical | 150 | HPPO | 2021 | |
Shandong | CITIC Guoan Group Corporation | 80 | PO/SM | 2019 |
Wanhua Chemical | 300 | PO/SM | 2021 | |
Zibo Qixiang Tengda Co., Ltd. | 300 | HPPO | 2021 | |
Befar Group | 300 | PO/SM | 2021-2022 | |
East China | Jiangsu Fuqiang New Materials Co., Ltd. | 200 | HPPO | End-2019 |
Jiangsu Bluestar Green Technology Co., Ltd. Phase I | 200 | HPPO | End-2019 | |
Taixing Yida Chemical Phase I | 150 | HPPO | 2020 | |
Sinochem Quanzhou Petrochemical Co., Ltd. | 300 | PO/SM | 2021 | |
Ningbo ZRCC Lyondell Chemical Co., Ltd. | 300 | PO/SM | 2022 | |
South China | CNOOC and Shell Petrochemical Co., Ltd. | 290 | PO/SM | 2020 |
Fujian Gulei Petrochemical Co., Ltd. | 240 | PO/SM | 2021 | |
Total | 3 010 |
Narrowing price range
The overall operating rates and output increased in 2019, but the price range narrowed compared to 2018. The average price of PO was RMB9 763/t in the first half of 2019, down by 16.77% year on year.
The prices are likely to rebound moderately as a result of stably increasing domestic demand in the coming three to five years.
The average profit in the first half of 2019 came in at RMB1 587/t, marking a year-on-year decrease of 48.82%, and the profit operational range fell to around RMB1 000/t. The margin room will remain in a relatively positive range in the next three to five years till the PO market turns surplus.