By Lei Lijing, Liu Junkai, PetroChina Jilin Chemical Engineering Co., Ltd.
Domestic production concentrated in Shandong
Propylene oxide (PO) capacities were at 2.205 million t/a in 2013 and reached 3.255 million t/a in 2018, reflecting an annual growth rate of 8.1% during the period. With no new PO plants put into production in 2018, the output was at 2.75 million tons and the average operating rates were at 84.5%. Table 1 shows the breakdown of major PO producers in 2018.
Table 1 Chinese PO producers 2018
Producers | Capacity (kt/a) | Production process |
Shandong Wudi Xinyue Chemical Co., Ltd. | 350 | |
Shandong Befar Group Co., Ltd. | 280 | |
Shandong Sanyue Chemical Co., Ltd. | 240 | |
Shandong Jinling Chemical Co., Ltd. | 160 | |
Tianjin Dagu Fine Chemical Co., Ltd. | 150 | |
Fangda Jinhua Chemical Technology Co., Ltd. | 130 | |
Shandong Daze Chemical Co., Ltd. | 100 | |
ChemChina Shandong Bluestar Dongda Co. Ltd. | 80 | |
Shandong Shida Shenghua Chemical Group | 80 | |
Shandong Huatai Group Co., Ltd. | 80 | |
Nanjing KUMHO GPRO Chemical Co .,Ltd. | 80 | |
Fujian Meizhouwan Chlor-alkali Industry Co., Ltd. | 40 | |
Wanhua Chemical Group Co., Ltd. | 240 | PO/MTBE |
Jinling Huntsman New Material Co., Ltd. | 240 | PO/MTBE |
CNOOC-SHELL Petrochemical Co., Ltd. | 320 | PO/SM |
(Ningbo) ZRCC Lyondell Chemical Co., Ltd. | 285 | PO/SM |
Jilin Shenhua Chemical Industry Co., Ltd. | 300 | HPPO |
Sinopec Changling Refining & Chemical Co., Ltd. | 100 | HPPO |
Total | 3 255 |
The majority of Chinese PO producers are concentrated in Shandong, adopting chlorohydrination process. In 2018, Shandong was ranked No. 1 in the capacities of 1.61 million t/a, accounting for 49.5% of the total; east China came with the second place, with the capacities at 605 kt/a, taking up 18.6%; northeast China held 430 kt/a of capacities, occupying 13.2%; south China held 360 kt/a, taking up 11.1%.
The period of 2013-2018 marked a slowdown in the PO capacity growth, as the construction of new chlorohydrination-based units was banned for environmental protection while the industrialized use of new technologies was developing slowly. With some new PO plants coming online in the years to come, the domestic PO market will embrace an onset of capacity release late in the 13th Five-Year Plan period. It is expected that the PO capacities will reach 5.705 million t/a by 2023. Table 2 shows PO production in construction plan.
Table 2 Chinese PO production in construction plan
Producer | Location | Capacity (kt/a) | Technology process | Start-up time |
Jiangsu Hongbaoli Group Taixing Chemical Co., Ltd. | Taizhou, Jiangsu | 120 | CHP | January 2019 |
Taixing Yida Chemical Co., Ltd. | Taixing, Jiangsu | 150 | HPPO | 2019 |
Citic Guoan Group Co., Ltd. | Heze, Shandong | 80 | PO/SM | 2019 |
Jiangsu Fuqiang New Material Co., Ltd. | Huai’an, Jiangsu | 100 | HPPO | 2019 |
CNOOC-Shell Petrochemical Co., Ltd. | Huizhou, Guangdong | 300 | PO/SM | 2020 |
Fujian Gulei Petrochemical Co., Ltd. | Zhangzhou, Fujian | 200 | HPPO | 2020 |
Wanhua Chemical Group Co., Ltd. | Yantai, Shandong | 300 | PO/SM | 2021 |
Sinopec Quanzhou Petrochemical Co., Ltd. | Quanzhou, Fujian | 200 | PO/SM | 2021 |
Tianjin Dagu Fine Chemical Co., Ltd. | Tianjin | 200 | PO/SM | 2021 |
Zhejiang Petrochemical Co., Ltd. | Zhoushan, Zhejiang | 200 | PO/SM | 2021 |
Shandong Jincheng Petrochemical Group | Shandong | 300 | HPPO | 2021 |
Zibo Qixiang Tengda Chemical Co., Ltd. | Zibo, Shandong | 300 | HPPO | 2021 |
Total | 2 450 |
Polyether polyol – a major derivative of PO
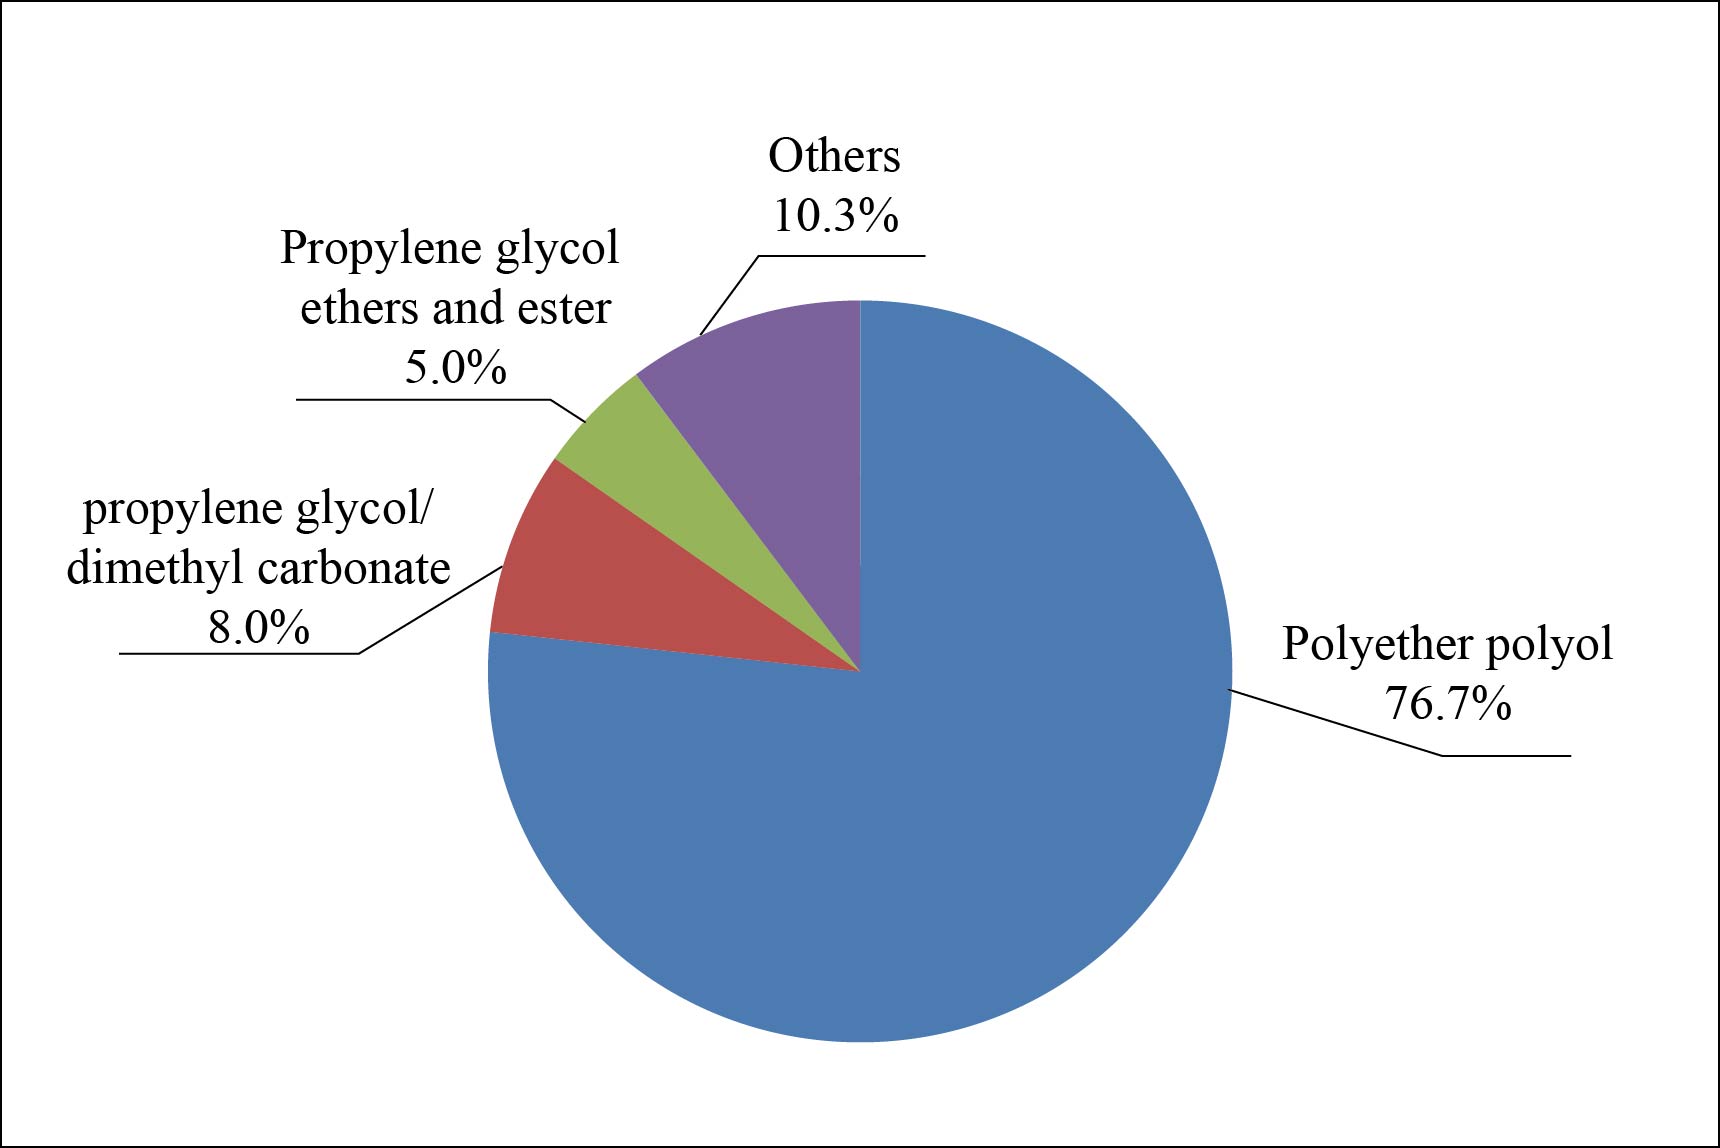
Chinese PO apparent consumption was at 2.187 million tons in 2013 and reached 3 million tons in 2018, with an average annual growth rate of 6.5% during the period. China’s PO products are mainly used in the production of polyether polyol – a major raw material of polyurethane (PU), taking up 76.7% of the total demand; propylene glycol/dimethyl carbonate consume approximately 8%; propylene glycol ether consumes about 5% of PO; besides, PO is mainly applied in the sectors of nonionic surfactant, isopropanolamine, TCPP flame retardant and cellulose. Figure 1 shows the consumption structure in Chinese PO market.

Figure 1 Chinese PO consumption structure
Diversified technologies scramble for market shares, green technologies to be dominant
PO production is mainly based on four processes - chlorohydrination, co-oxidation (PO/SM and PO/MTBE), CHP and HPPO. Producers favored chlorohydrination process because of the simple procedures, mature technology, limited investment and low costs, but it was classified as a restriction product in Guiding Catalogue of Industrial Structure Regulation in 2011 because it could generate a big amount of waste water and residues, very unfriendly to the environment.
Co-oxidation process is divided into two routes – PO/SM and PO/TBA. PO/SM process could make PO and coproduct SM from propylene, hydrogen and ethylbenzene, while PO/TBA process is to produce PO and coproduct TBA from propylene, oxygen and isobutene. In recent years, few PO/TBA-based units have been built due to a lack of takers for TBA. Co-oxidation process, featured with complicated procedures, large investments and a big amount of coproduct output, is more applicable to big-sized refining & chemical integration plants with sufficient feedstock.
CHP is a process modified from the co-oxidation. Compared with PO/SM route, CHP process adopts cumene to replace ethylbenzene as cumene is renewable and the process generates no byproduct; compared with chlorohydrination, CHP is an environment-friendly clean production process that does not pollute the environment and corrode equipment, with a small amount of waste water discharge, but the production cost is higher.
During the HPPO process, only PO and water, together with a very small amount of byproduct propylene glycol, are produced. The biggest advantage of the process is simple procedures, high product yield and no pollution. Besides, it’s a clean production process, with the waste water discharge 70-80% less than chlorohydrination-based process. However, the investments on the introduction of HPPO plants are quite high and the production cost is high following lofty hydrogen peroxide and catalyst. As Chinese producers started seeking smaller investment and lower production costs, local HPPO technology has an advantage over imported one. The process is applicable to sites with abundant hydrogen resources that usually help price the raw material low, and it can co-build with PDH plants as a whole set.
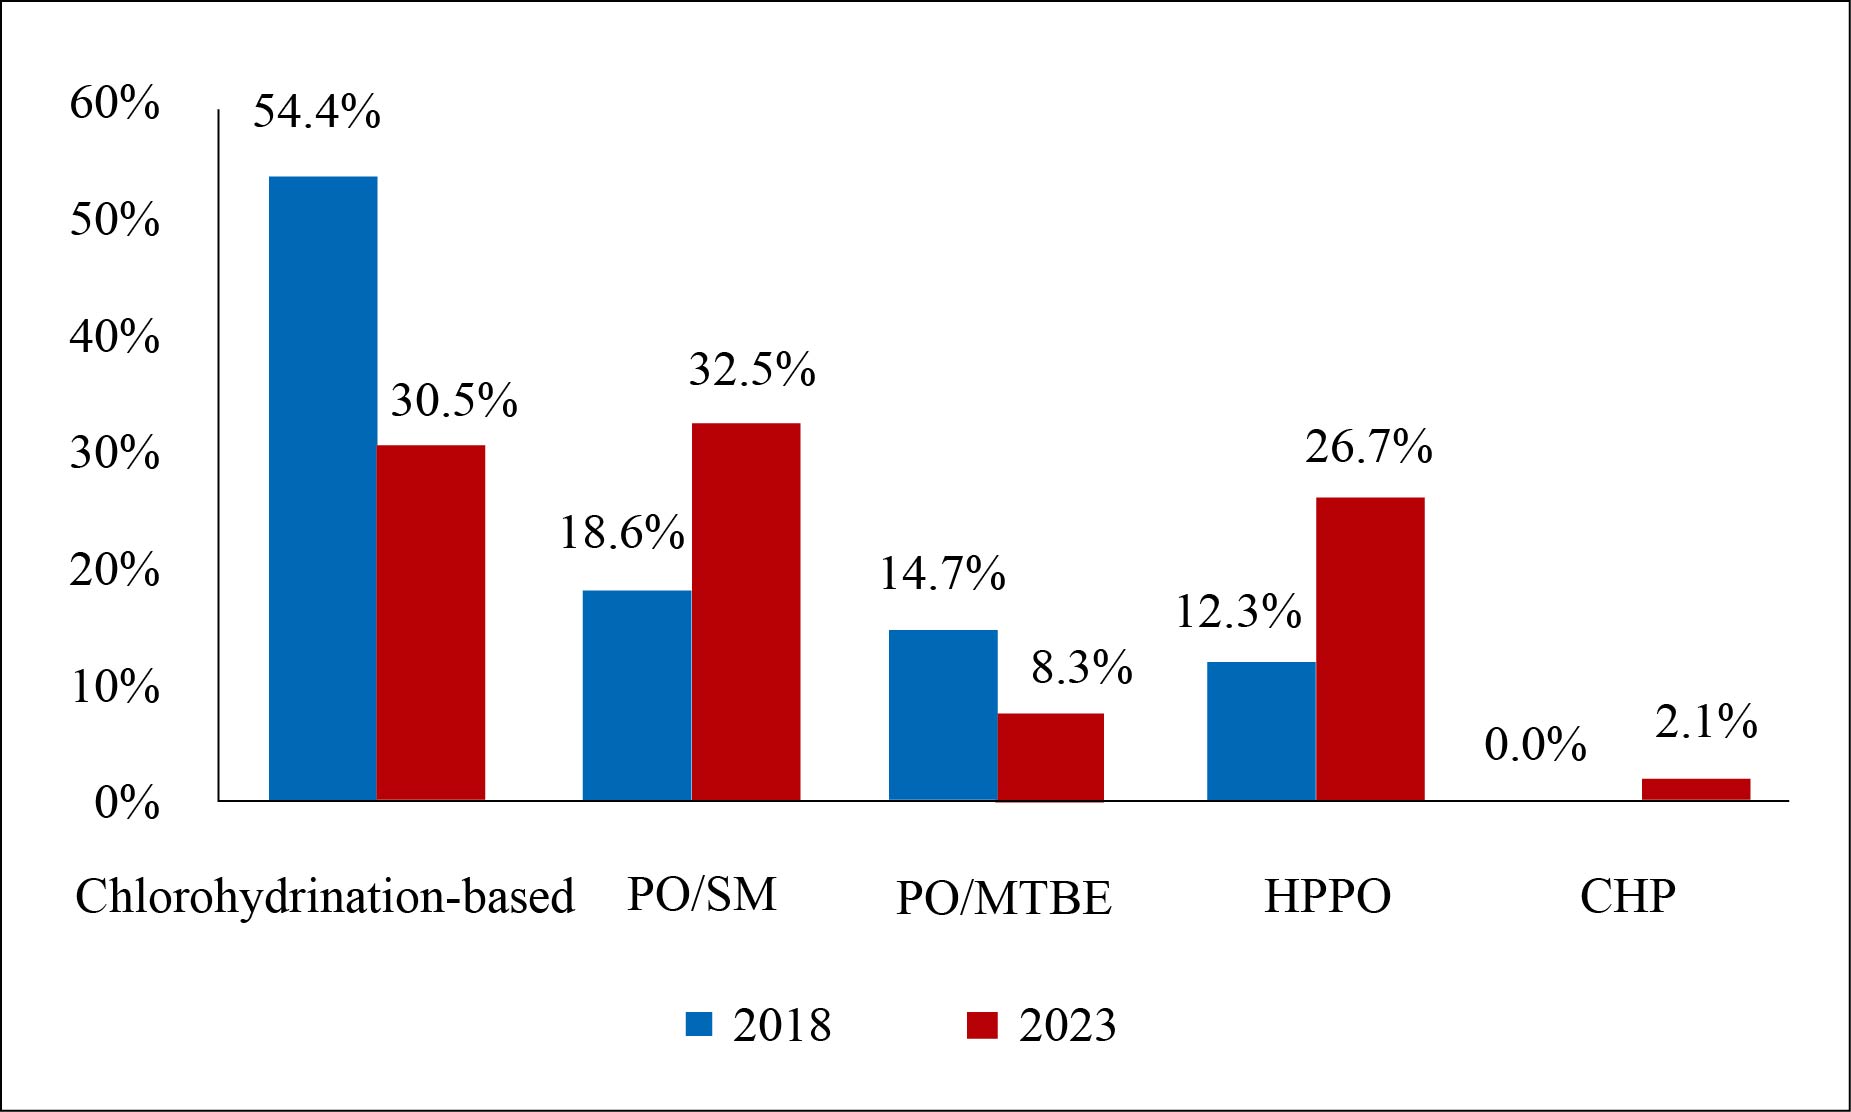
In China, most of the PO products are made by chlorohydrination process, accounting for over the half of the total. However, the process has been restricted by the government’s environmental-protection policies in recent years, and hence most of the new PO plants scheduled to be built adopt HPPO and PO/SM processes. In the coming few years, the domestic PO market will see a diversification of technologies, and the green technologies will be increasingly prevailing while the share of the output based on chlorohydrination process will keep shrinking. Figure 2 shows the proportion of various PO processes in China.

Figure 2 Proportion of various PO processes in China
Chinese PO market will embrace a fast-growth phase in the coming five years. The competition will be more furious. To be specific, chlorohydrination-based producers will suffer a lot under heavier pressure of environmental protection and increasing capacities across the board, so laggard capacities will be driven out of the market gradually.