By Shi Lei, OilChem China
Domestic supply of PVC kept rising, and operating rates rose year by year
China’s PVC capacity was down 0.6% YoY to 24.51 million t/a in 2018. Given unevenly distributed resources and production costs, most of the products (around 83%) adopted calcium carbide process, and 15% was made by ethylene method. The remaining 2% utilized either MTO process (methanol to olefins) or natural gas method.

Figure 1 Changes of China’s PVC capacity during 2014-2018
Northwest China is a major PVC producing area, boasting a capacity of 12.05 million t/a in 2018, followed by north China (5.56 mn t/a) and east China (2 mn t/a). The three regions accounted for 52%, 24% and 9% of the nation’s total capacity, respectively. The remaining capacity came from central China (1.62 mn t/a, 7%), southwest China (1.34 mn t/a, 6%), northeast China (1%) and south China (1%).
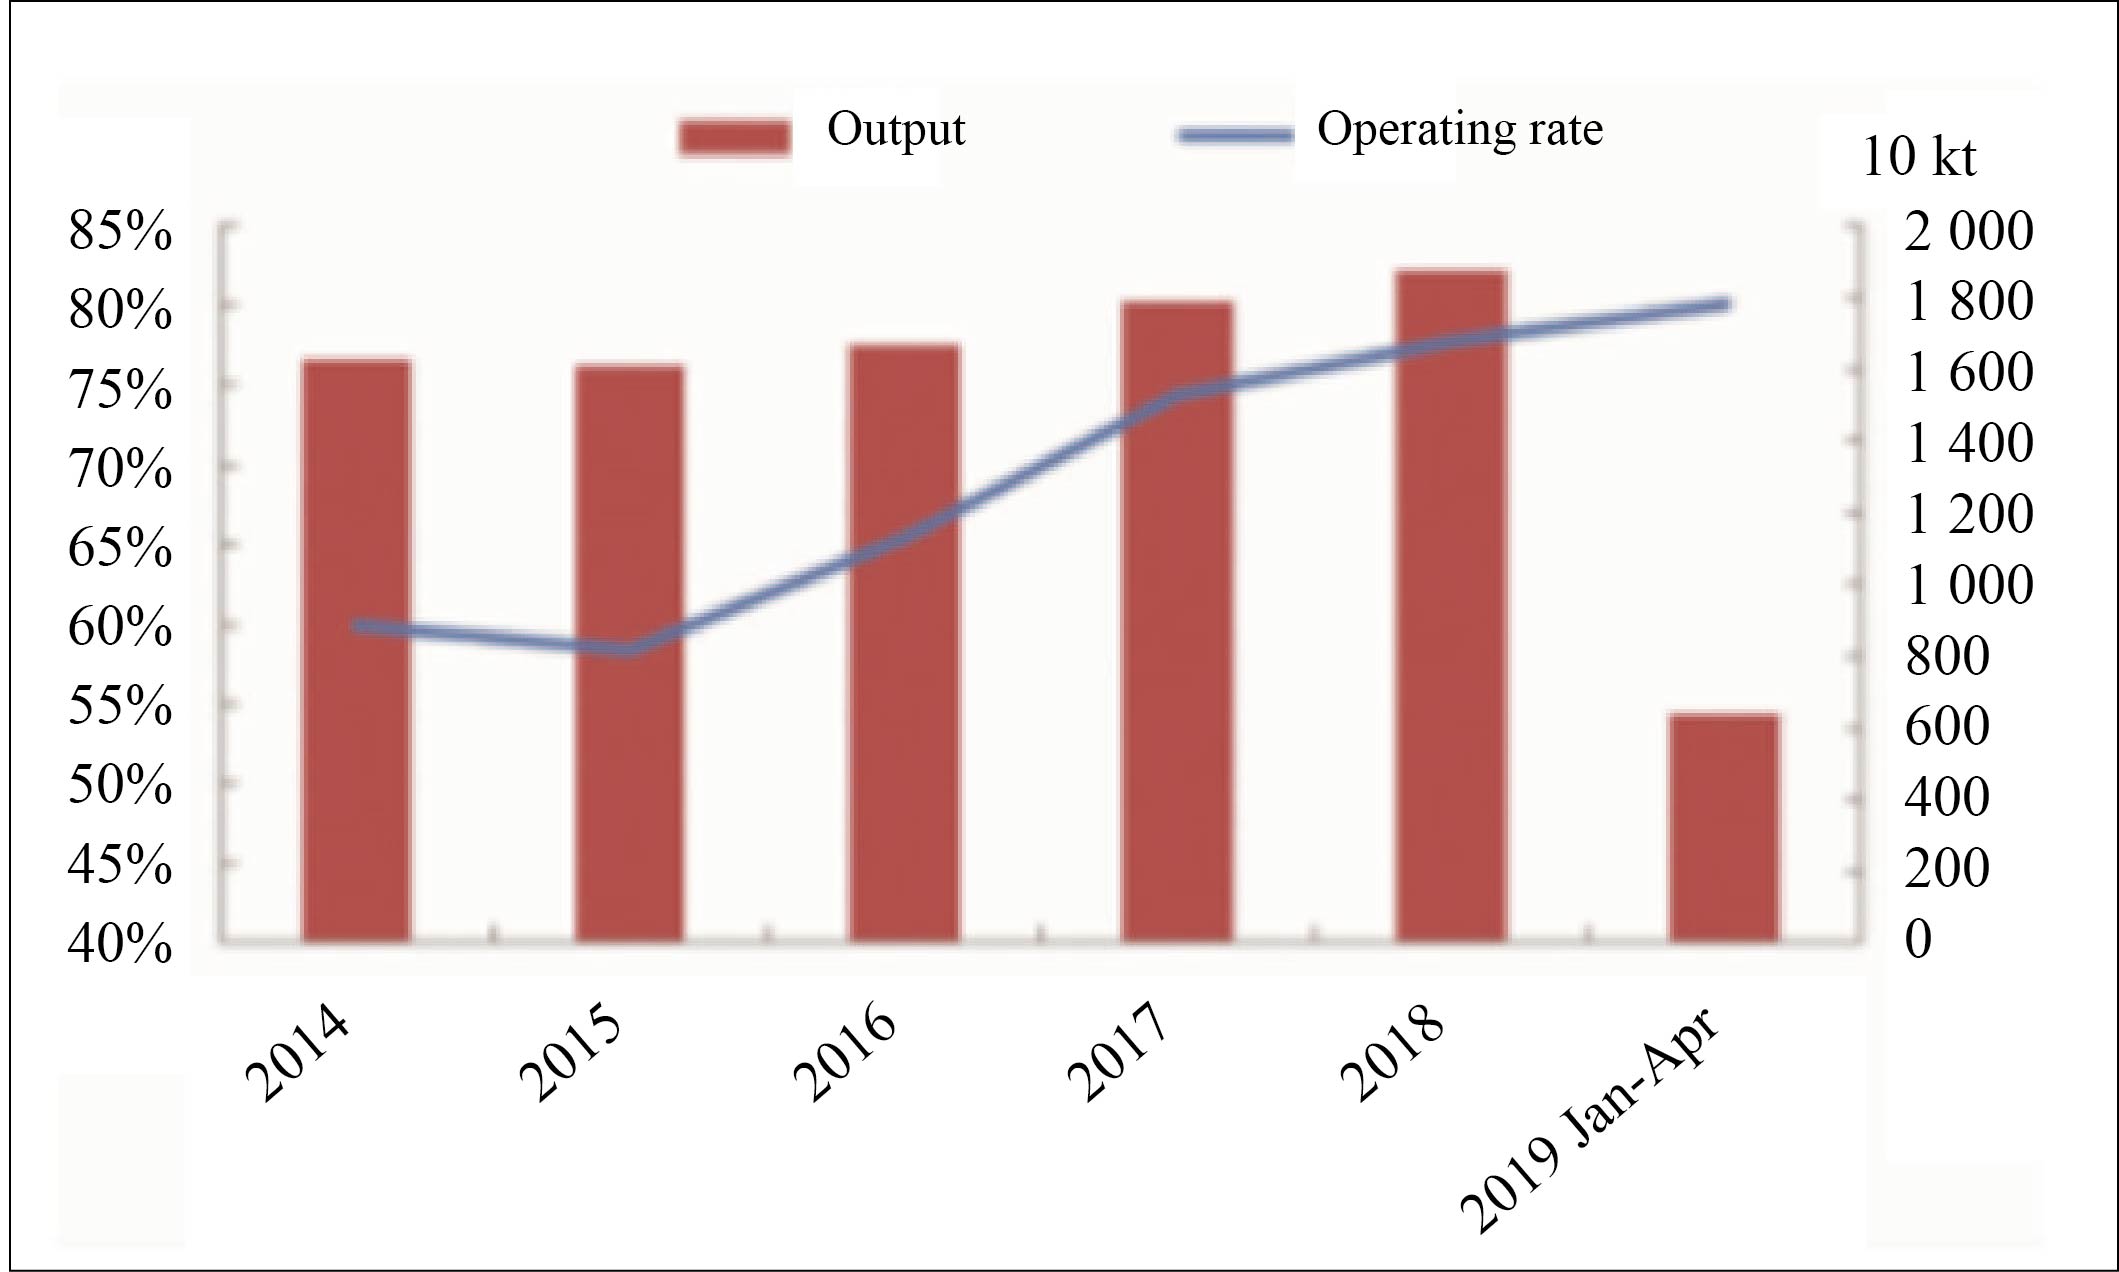
As domestic PVC producers suffered sustained losses, PVC output fell during 2014-2015. However, with the profits improving, output and operating rates have both rebounded since 2016, with the average operating rate in 2018 reaching 77.74%, up 19.35 percent points from the lowest point in 2015. Operating rates remained high in 2019, averaging at 80.09% during January-April, with the output totaling 6.39 million tons in the four months.

Figure 2 Operating rates and output of China’s PVC enterprises during 2014-April 2019
PVC import was stable, but export volume failed to increase
China’s dependence on imported PVC fluctuated from minus 0.39% to 0.78% during 2014-2018 (see Table 1 for details), and the import volume was relatively stable, amounting to 736 200 tons in 2018 mainly from Taiwan, the US, Japan and South Korea.
Table 1 China’s PVC import during 2014-2018
Year | Import (kt) | Dependence on imported PVC (%) |
2014 | 678.0 | -2.70 |
2015 | 711.3 | -0.39 |
2016 | 648.0 | -2.40 |
2017 | 771.6 | -1.04 |
2018 | 736.2 | 0.78 |
China exported PVC mainly to India, Uzbekistan and Malaysia, and can hardly expand the export, due to better quality and lower prices of foreign products.
Table 2 China’s PVC export during 2014-2018
Year | Export (kt) |
2014 | 1 105.8 |
2015 | 774.0 |
2016 | 1 038.6 |
2017 | 956.7 |
2018 | 592.0 |
Domestic demand for PVC kept rising rapidly, and downstream industry clusters still concentrated in east China
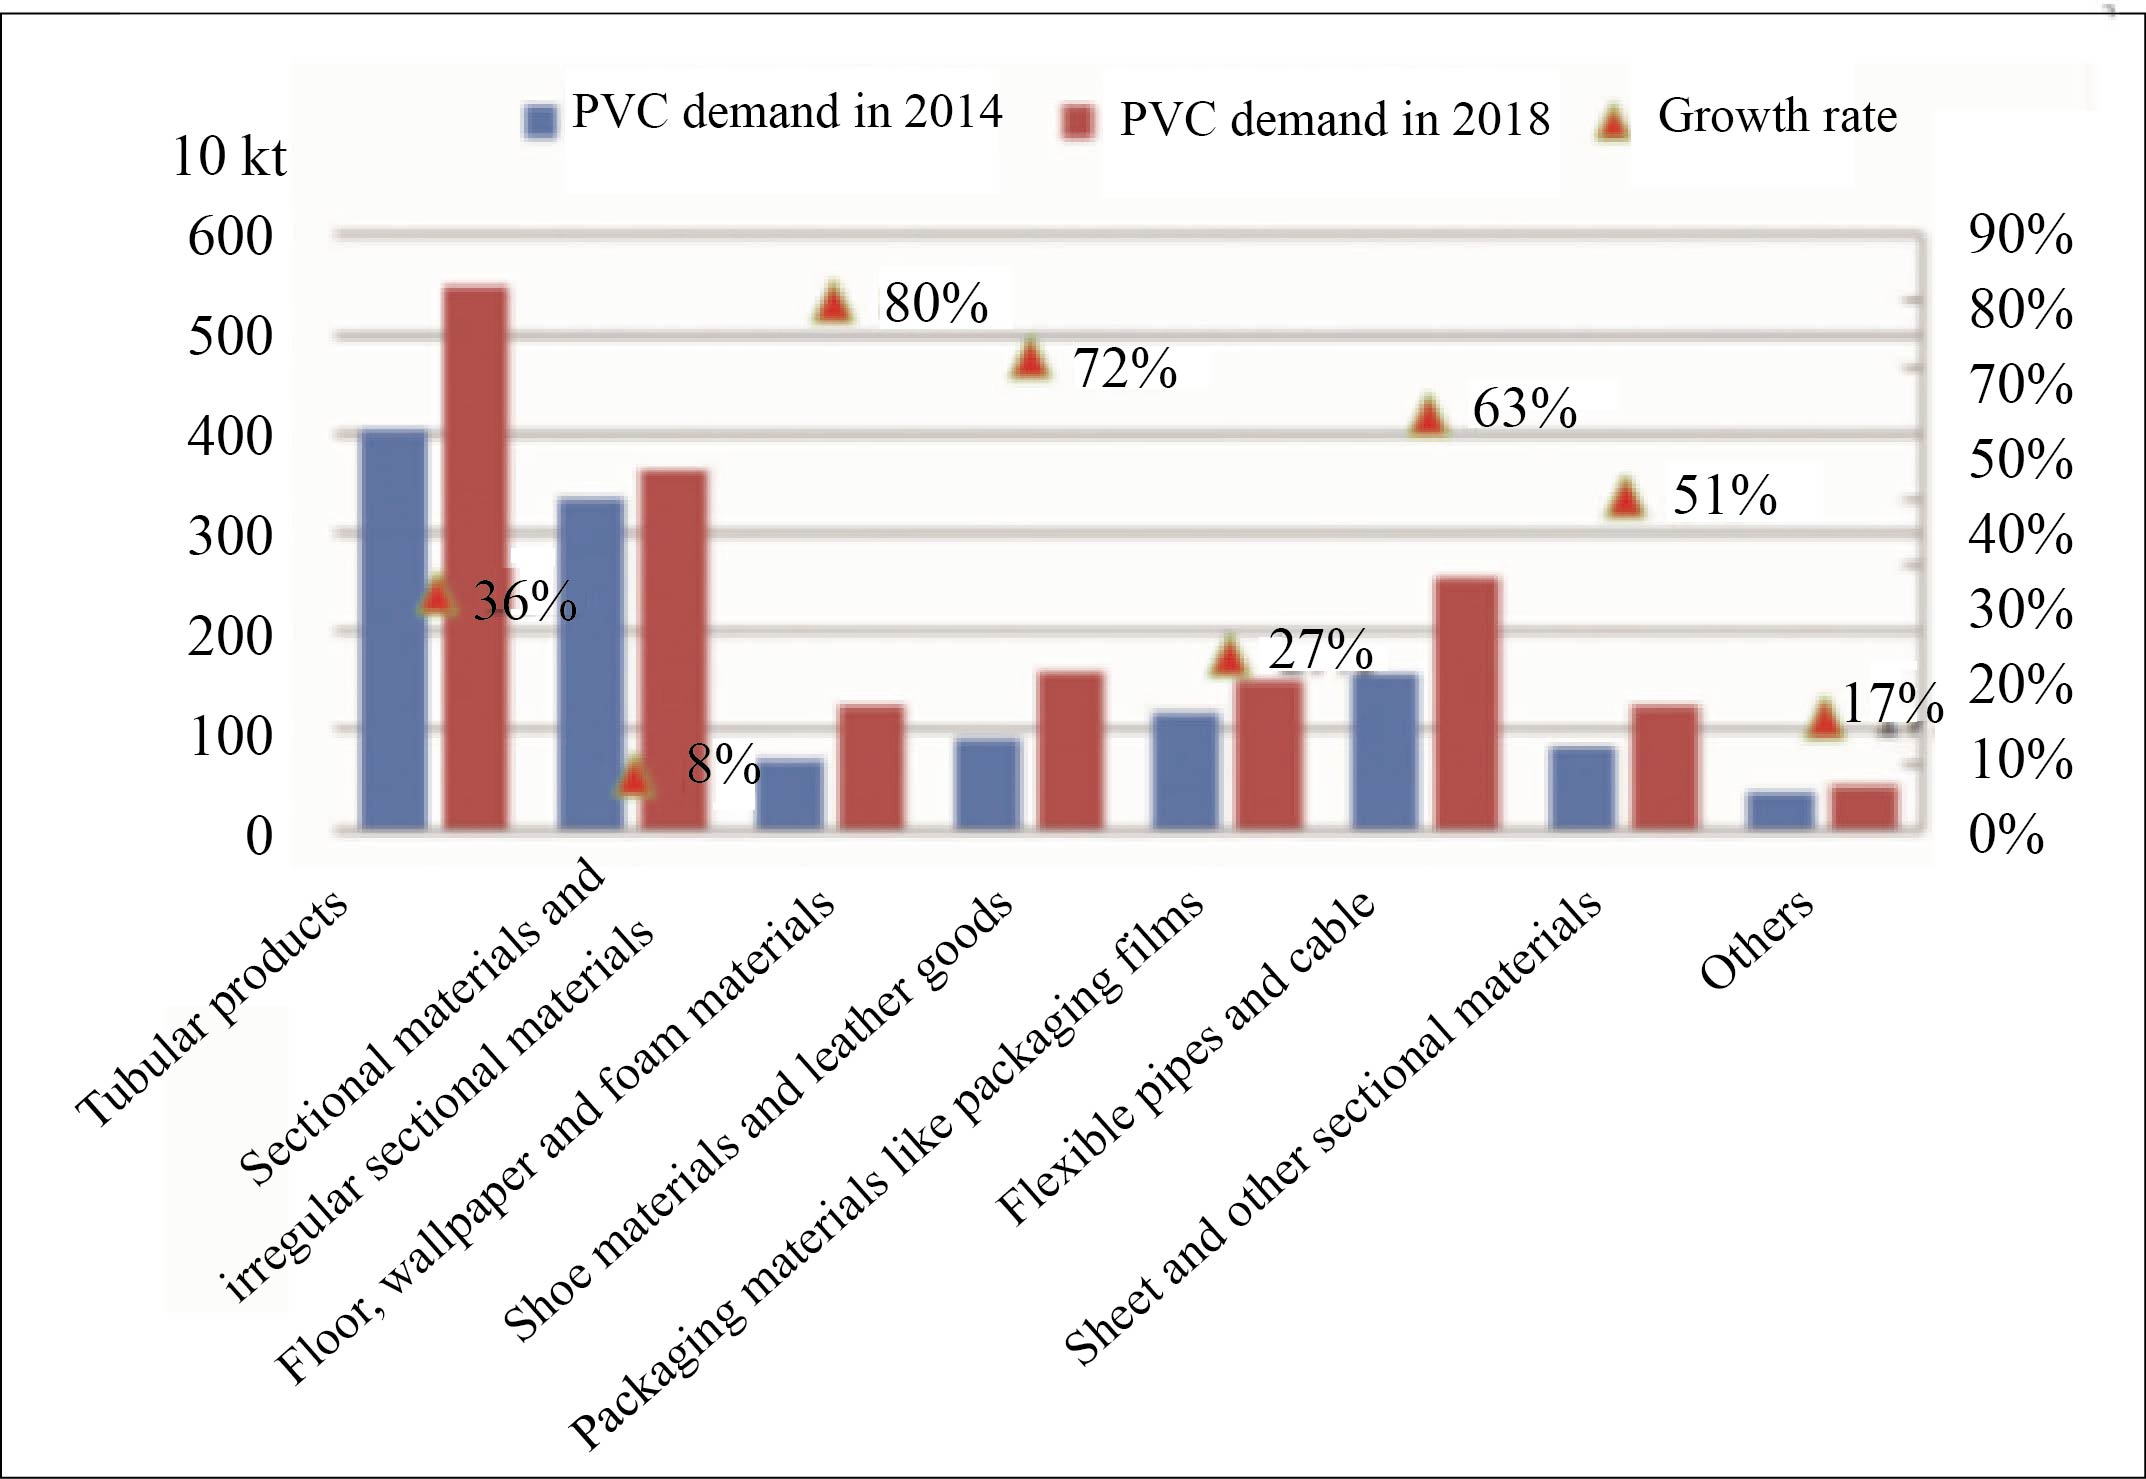
Among downstream demand for PVC, materials related to the real estate industry saw faster growth in the past five years – 31% applied in tubular products; 21% in sectional materials and irregular sectional materials; 9% in flexible pipes and cable; 7% in floor, wallpaper and foam materials. Leather products showed no long-term potential, because of environmental pressure and severe competition with other materials. Packaging films maintained steady growth in demand for PVC.

Figure 3 Structure changes in downstream demand for PVC